Sales reporting
Sales reporting without the Friday spreadsheet: one team’s weekly numbers, rebuilt on live records
In many growing sales teams, the weekly report is a ritual. Someone exports from three places, pastes into a workbook, fixes the formulas that broke, and emails a PDF that is out of date before anyone opens it. This article follows one illustrative team through that ritual, counts what it costs, and rebuilds the same report on live records in Saleslox.
The scenario: the Friday report at a ten-person sales team
Illustrative scenario. Northgate Labware, its people and its numbers are invented to show a common pattern. It is not a Saleslox customer, and no results are claimed for it.
Northgate Labware sells laboratory consumables and small instruments to universities and private labs. It has a sales director, Priya, seven account managers and one sales coordinator, Tom, who also handles quotes. Every Friday afternoon Tom builds the weekly sales report.
The recipe has not changed in two years. He exports open deals from the CRM nobody fully trusts, copies new enquiries from the shared leads sheet, and pastes the list of quotes sent from his own tracking tab. He runs a lookup to match company names, fixes the rows where someone typed “Uni of Leeds” instead of “University of Leeds”, rebuilds two pivot tables and copies the charts into a slide. By the time Priya opens it on Monday, three deals have moved and one has closed.
Nobody is doing anything wrong. Tom is careful. The report is the problem: it is a copy of the work, assembled by hand, from sources that disagree.
The problem: a report that is a copy, not a view
A spreadsheet report has three weak points. It is late, because it shows the pipeline as it was when the export ran. It is fragile, because every paste and lookup is a chance to break a formula or drop a row. And it is argued over, because when Priya asks why a number changed, the answer lives in Tom’s head and in whichever file was open last.
Those weaknesses compound. When the director stops trusting the report, account managers start keeping their own versions “just to be sure”. Now there are eight reports, and the Monday meeting is spent reconciling them instead of deciding what to do.
What teams use today, and what it really costs
Exports and pivot tables
Exports feel safe because the data came from a system. But the moment it lands in a workbook it becomes a copy that nobody updates. Spreadsheet errors are also more common than most people assume. In a peer-reviewed audit of 50 operational spreadsheets from real organisations, researchers at Dartmouth found that 43 of the 50 contained at least one error that produced a wrong result, and that around 1% of all formula cells were in error [2]. A weekly report rebuilt by copy and paste gives those errors 52 chances a year.
Many tools stitched together
Northgate’s numbers live in a CRM, a leads sheet and a quote tracker. That is typical. Salesforce’s State of Sales report, a survey of 4,050 sales professionals, found that only about a third of sales teams (34%) work in one platform; the rest mix a platform with standalone tools or run many standalone tools, an average of eight per team. The same report found that 42% of sales reps feel overwhelmed by too many tools [1]. Each extra tool is another export in the Friday recipe.
Manual data entry
Reports built from copied rows inherit every typo. In the same survey, sales teams using AI agents ranked manual errors as their number-one data issue, ahead of duplicate data [1]. A report cannot be more accurate than the rows it is built from.
The hidden time
Tom’s Friday afternoon is the visible cost. The invisible one is the hour each account manager spends checking “their” numbers before Monday, and the meeting time lost to arguing about whose figure is right.
How Saleslox produces the same report
The fix is not a better template. It is to stop copying. In Saleslox the report reads the same records the team works in, so it is current whenever someone opens it. The screenshots below are real Saleslox screens from a demo workspace on the Enterprise plan; where a feature depends on the plan, we say so.
Step 1: one overview dashboard instead of a slide
The Sales overview dashboard starts with an “At a glance” row: pipeline value, number of opportunities, leads, quotes, orders, amount invoiced and average lead score. Below it, “How the pipeline moves” shows deal flow by stage as a funnel, from Lead In through Qualifying, Proposal, Negotiation, Closed Won and Closed Lost, alongside a lead mix chart. Priya opens it on Monday morning and sees the pipeline as it is, not as it was on Friday.

Standard dashboards are included on every plan. Professional and Enterprise add the custom dashboard designer, so a team can build its own review view once, with an Edit button on the dashboard when the questions change, instead of rebuilding a workbook every week.
Step 2: the pipeline report is the board
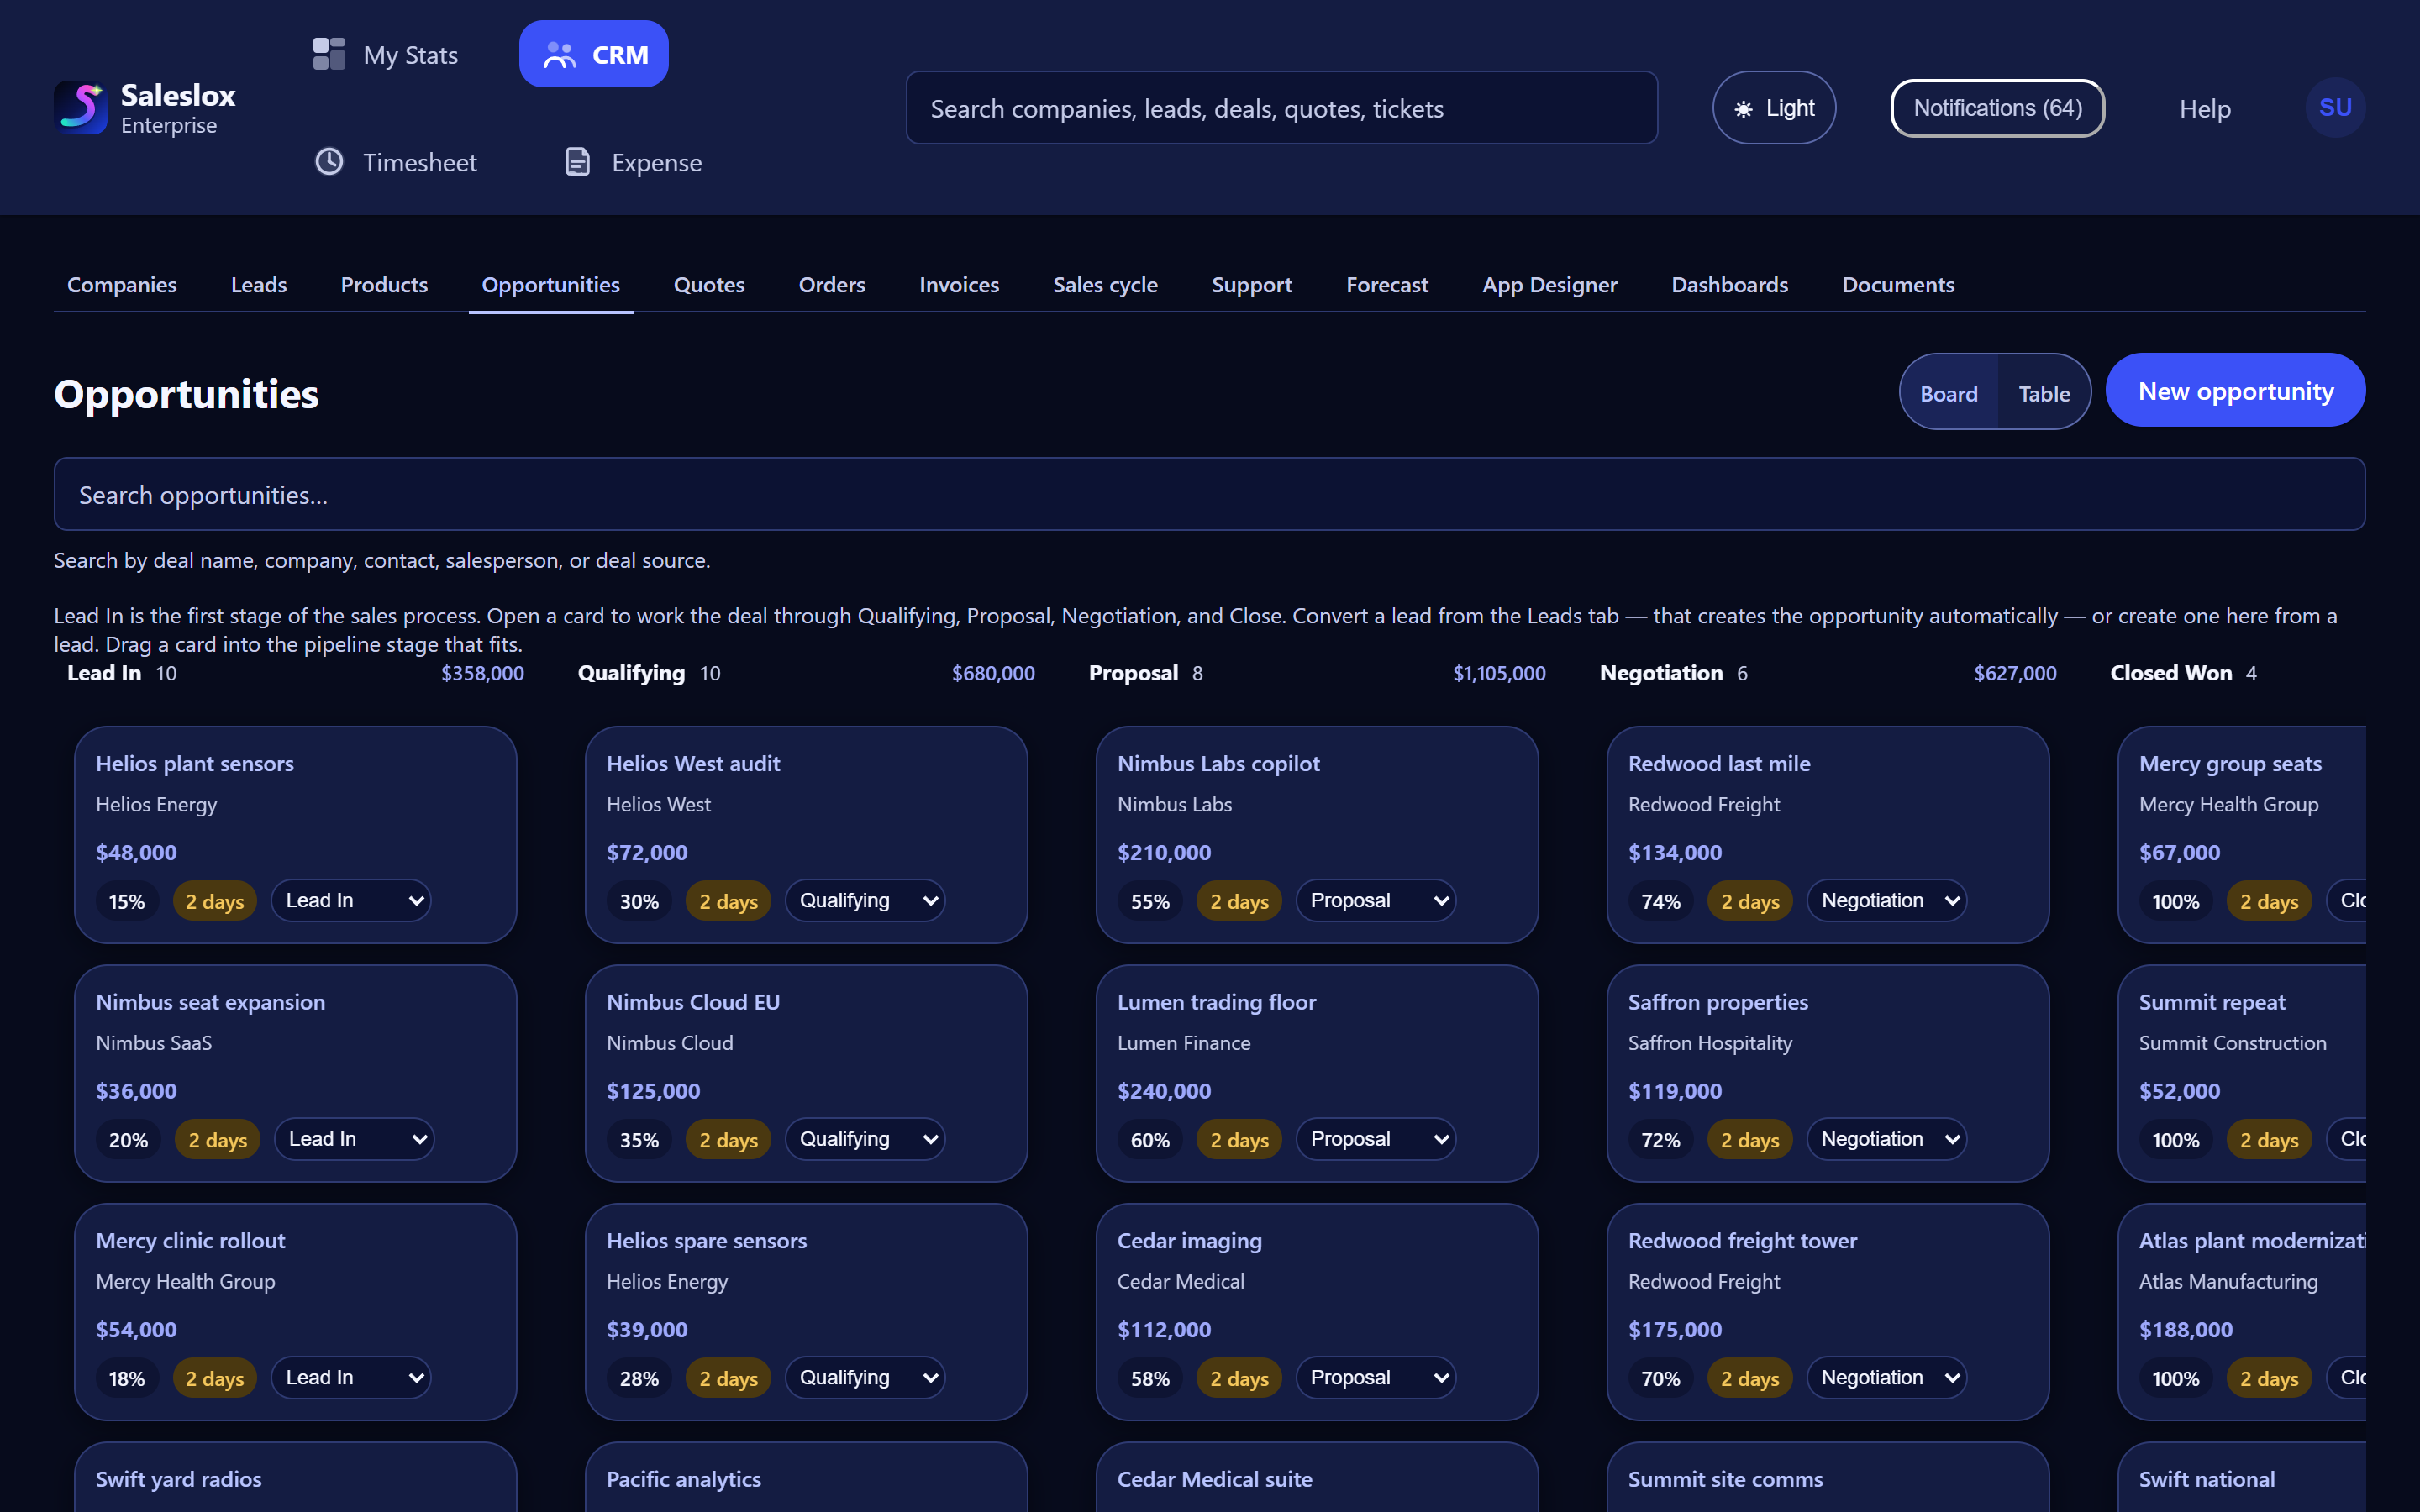
Tom used to rebuild a “pipeline by stage” pivot table. In Saleslox the opportunity board already shows each stage with its deal count and total value, and every card shows value, probability and how long it has been in its stage. The team can switch to a table view and search by deal name, company, contact, salesperson or deal source. When an account manager drags a deal from Proposal to Negotiation, the report changes because the record changed.
Step 3: forecast and quota on the same records
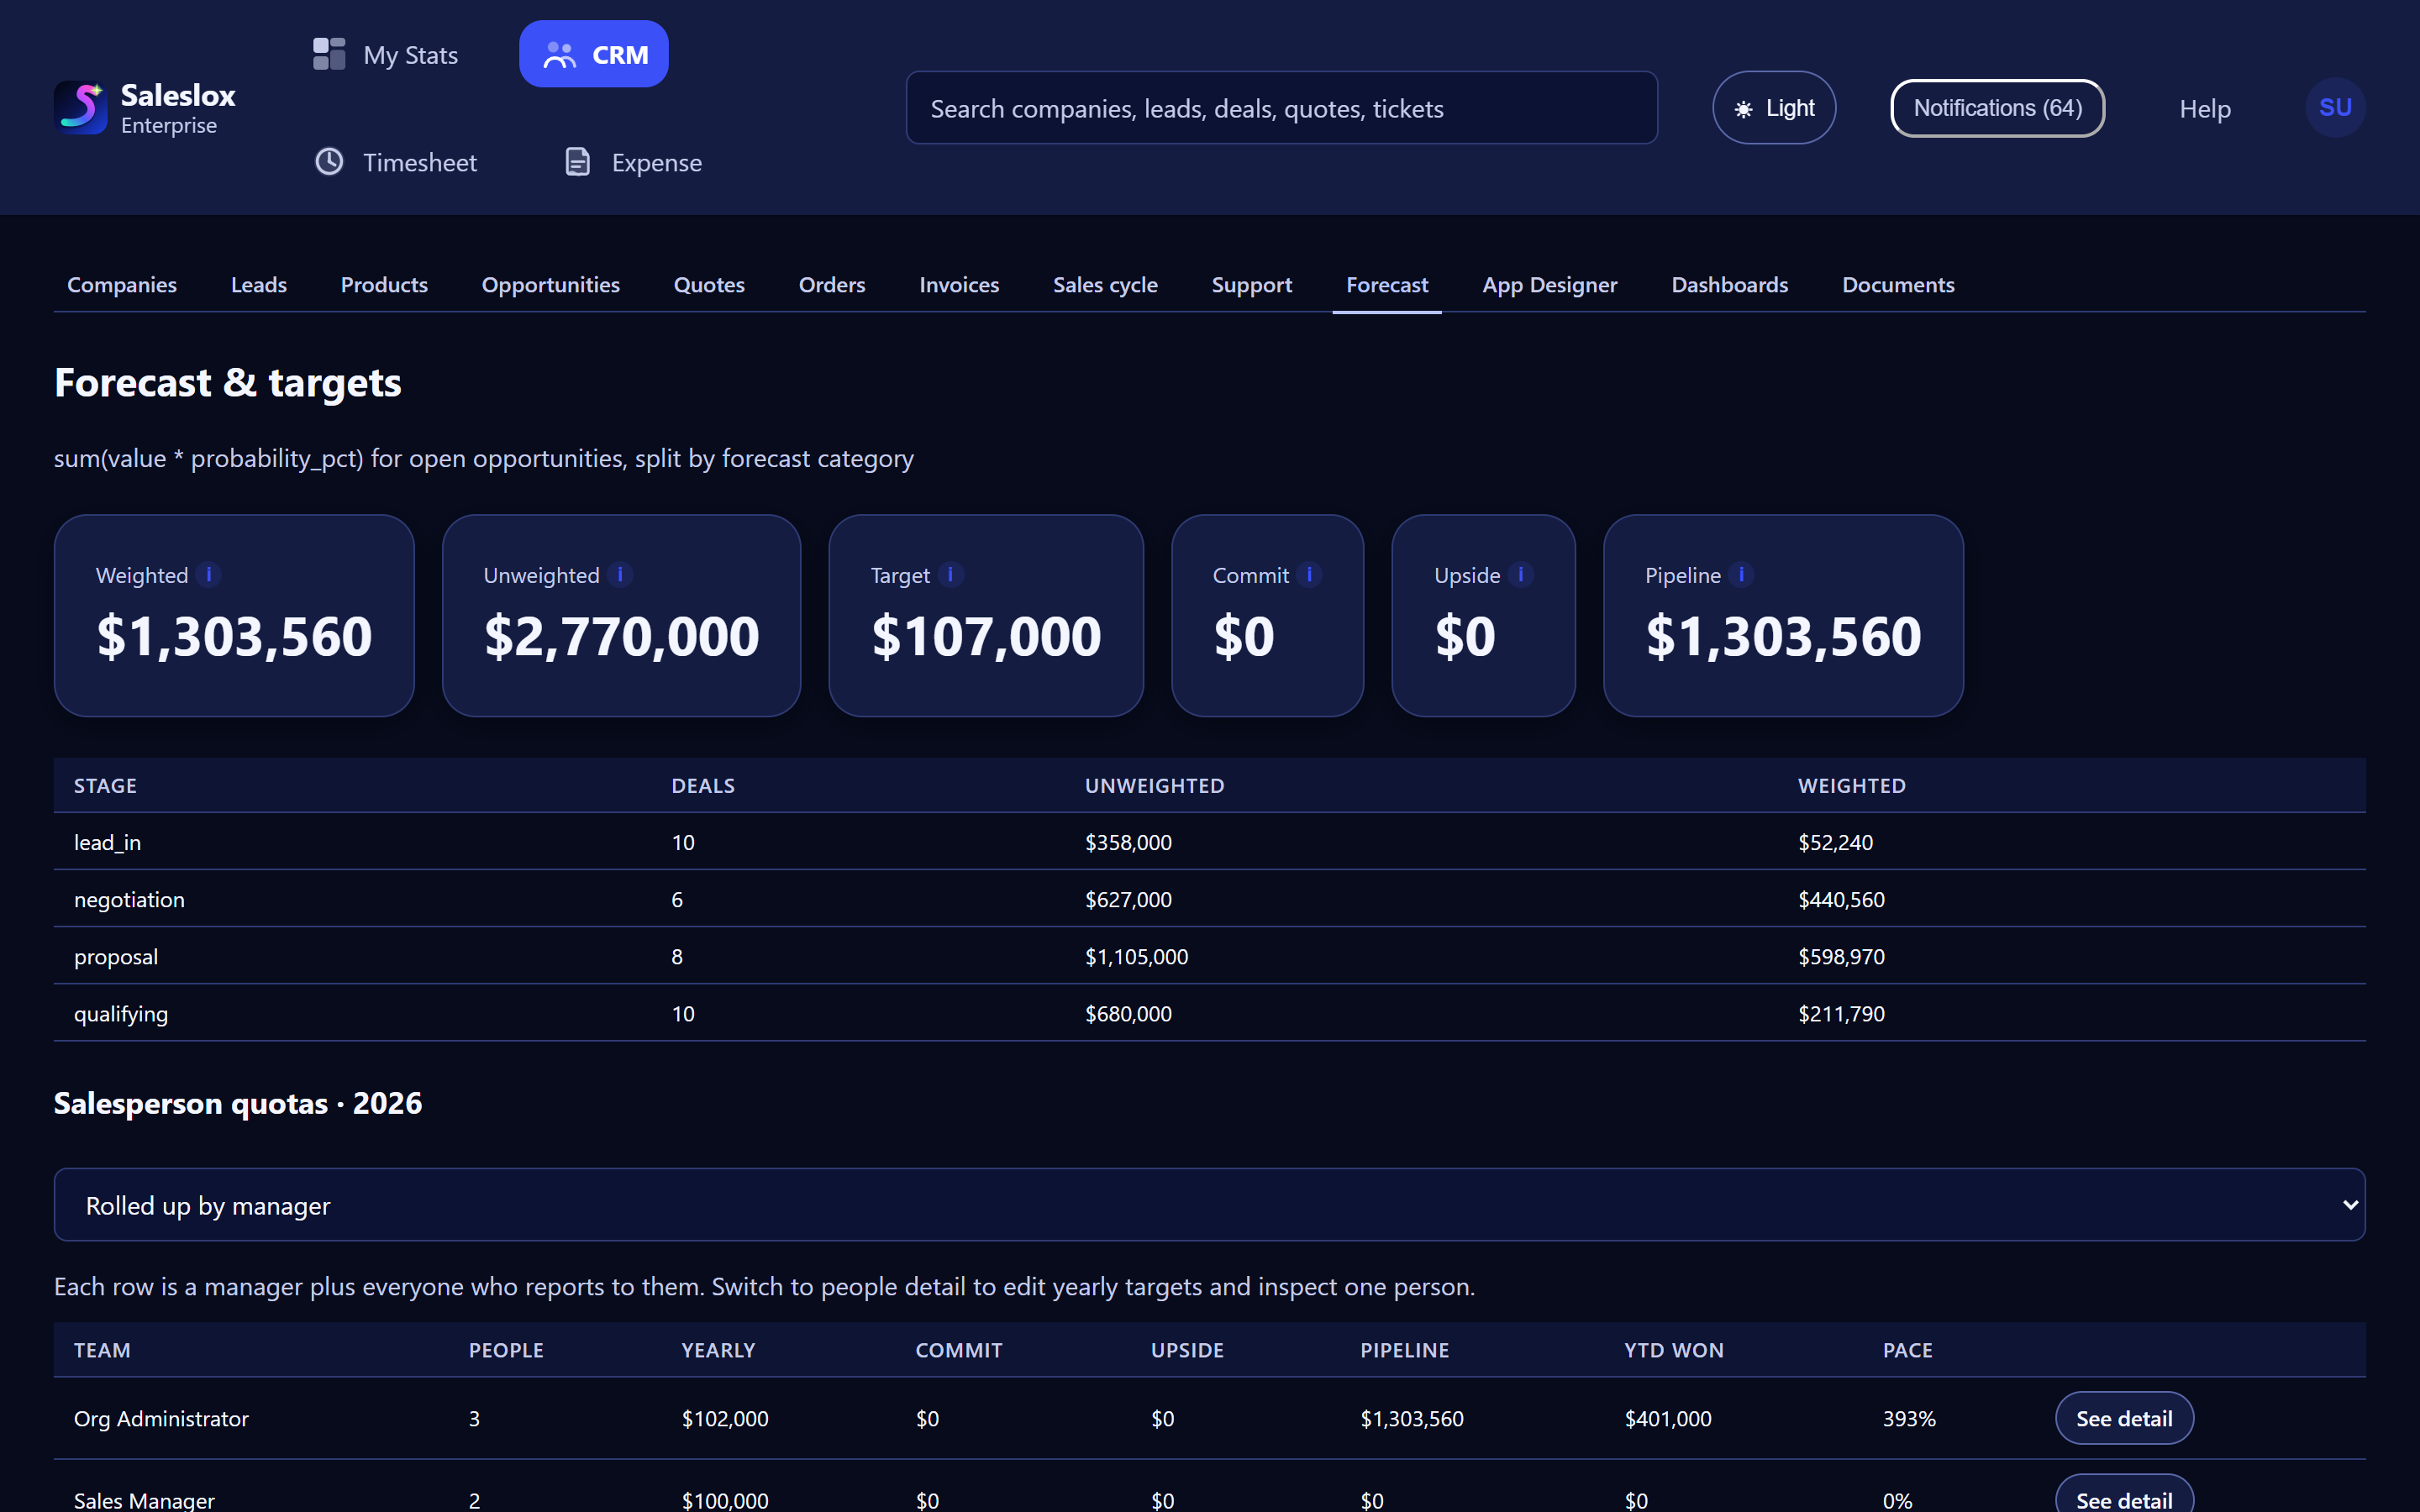
The second half of Tom’s report was a forecast tab. The Forecast & targets screen calculates the weighted forecast as value times probability for open opportunities, and shows weighted, unweighted, target, commit, upside and pipeline totals, a breakdown by stage, and salesperson quotas rolled up by manager with yearly target, year-to-date won and pace. Forecasting and targets are on Professional and Enterprise.
Step 4: a weekly review that starts from the screen
With the dashboard, the board and the forecast reading the same records, the Monday meeting changes shape. Instead of “is this number right?”, the questions become “why has this deal been in Proposal for three weeks?” and “what would move the commit?”. On Professional and Enterprise, opportunity aging and stalled-deal alerts point the conversation at the deals that have gone quiet. For a meeting format that uses these screens, see how to run a weekly pipeline review without a second spreadsheet.
Friday spreadsheet vs live reporting
| Task | Friday spreadsheet | Saleslox |
|---|---|---|
| Getting the data | Exports from several tools, pasted together | Read directly from leads, opportunities, quotes and orders |
| Freshness | As of the last export | As of the last change to a record |
| Pipeline by stage | Pivot table rebuilt weekly | Opportunity board with stage counts and totals |
| KPIs | Formulas that break when columns move | At-a-glance tiles on the Sales overview dashboard |
| Forecast | Separate tab, separate maths | Weighted forecast from open opportunities, with quotas by manager |
| Changing the report | Edit the template and hope | Edit the dashboard (custom designer on Professional and Enterprise) |
| “Why did this number change?” | Ask the person who built the file | Open the record behind it |
What changes for a team like Northgate
In the illustrative scenario, Tom gets his Friday afternoon back for quotes. Priya stops receiving a PDF and starts opening a dashboard. Account managers stop keeping private versions, because the shared view is the same records they update. Spreadsheets do not disappear; they go back to being a tool for one-off analysis instead of the system the business runs on.
How to test this on your own numbers
- Take last Friday’s report and list the five numbers leadership actually looked at.
- Put your live opportunities on the board in their real stages, with value and probability.
- Open the Sales overview dashboard and check which of the five numbers are already there.
- Open Forecast & targets and compare the weighted figure with the one in your workbook.
- Run one Monday meeting from the screens instead of the PDF.
The trial is 30 days of Professional, with no card, so the dashboard designer and forecasting are switched on while you compare. For more on the forecast itself, read forecast that is the board, not fan fiction.
Frequently asked questions
What should a weekly sales report include?
Most weekly sales reports cover open pipeline by stage, new leads, quotes sent, deals won and lost, and the forecast against target. The important part is that every figure comes from the same records the team works in.
Can Saleslox replace our Excel sales report?
For the recurring report, yes: the Sales overview dashboard, the opportunity board and Forecast & targets read live records. Spreadsheets are still useful for one-off analysis.
Which plans include custom dashboards and forecasting?
Standard dashboards are on every plan. The custom dashboard designer, forecasting and targets, and opportunity aging are on Professional and Enterprise. The 30-day trial is Professional, with no card required.
How often does the dashboard update?
The dashboard reads the records directly, so it reflects the latest saved changes to leads, opportunities, quotes and orders rather than a scheduled export.
Is Northgate Labware a real Saleslox customer?
No. Northgate Labware and every person and number in its story are invented to illustrate a common pattern. No customer results are claimed.
Sources
- Salesforce (2026). State of Sales, 7th edition. Survey of 4,050 sales professionals in 22 countries, August–September 2025. salesforce.com
- Powell, S. G., Baker, K. R. and Lawson, B. (2009). “Errors in Operational Spreadsheets.” Journal of Organizational and End User Computing, 21(3), 24–36. mba.tuck.dartmouth.edu